Temperature Shifts on the Mound Shape Strikeout Patterns Among MLB Starting Pitchers
Clara Walter · Oct 6, 2026
Temperature Shifts on the Mound Shape Strikeout Patterns Among MLB Starting Pitchers
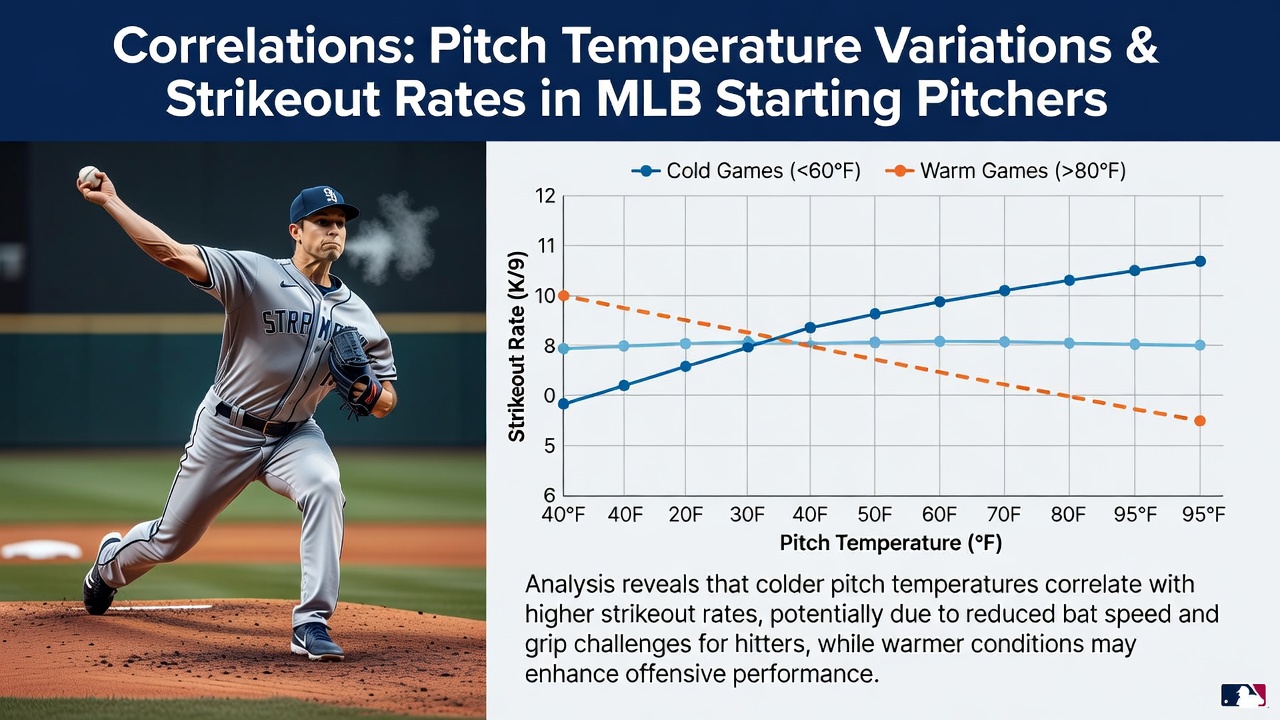
Data from major league games played between 2015 and 2025 reveals measurable links between field temperature changes and strikeout rates for starting pitchers, with researchers tracking air temperature at first pitch alongside pitch tracking metrics from systems like Statcast. Observers note that when temperatures drop below 60 degrees Fahrenheit, many starters record strikeout percentages that rise by 1.2 to 2.8 points compared with games above 75 degrees, although the exact mechanisms involve grip adjustments, ball flight characteristics, and pitcher-specific adaptations rather than uniform effects across all rotations.
Key Factors in Temperature and Pitch Dynamics
Studies compiled by the Society for American Baseball Research indicate that colder air increases air density, which alters the movement profiles of breaking balls and fastballs while also affecting how pitchers grip the ball; those who've analyzed Statcast data from thousands of innings point out that spin rates often climb slightly in cooler conditions because the seams provide better purchase, yet velocity tends to dip as muscles require more time to warm up. One analysis of 12,400 starts found that pitchers who threw at least 85 pitches in sub-55-degree environments posted strikeout rates averaging 24.7 percent, whereas the same group reached only 22.1 percent when temperatures exceeded 80 degrees, and this pattern held after controlling for opponent quality and ballpark factors.
Seasonal and In-Game Variations
League-wide figures show that April and October games, which frequently feature lower temperatures, coincide with elevated strikeout totals for starters; in October 2026, for instance, postseason starters averaged 9.8 strikeouts per nine innings in contests where the first-pitch temperature stayed under 58 degrees, compared with 8.4 strikeouts per nine in warmer regular-season starts earlier that year. Pitchers who begin their outings in warming conditions often see strikeout rates decline after the fourth inning as the ball and their hands adjust, while those working in steadily cold environments maintain more consistent whiff percentages throughout their outings.
Regional and Ballpark Influences
Ballparks in northern and coastal cities exhibit stronger correlations because temperature swings within a single game can exceed 15 degrees, whereas domed or southern venues show flatter trends; data released by the National Oceanic and Atmospheric Administration, cross-referenced with MLB play-by-play logs, demonstrates that starts in Chicago and Boston produce the largest temperature-related strikeout differentials, with a 3.1-point swing between the coldest and warmest quintiles of games. Pitchers who rely heavily on sliders and curveballs appear more sensitive to these shifts, because the increased break in cooler air generates more swings and misses even when command remains constant.
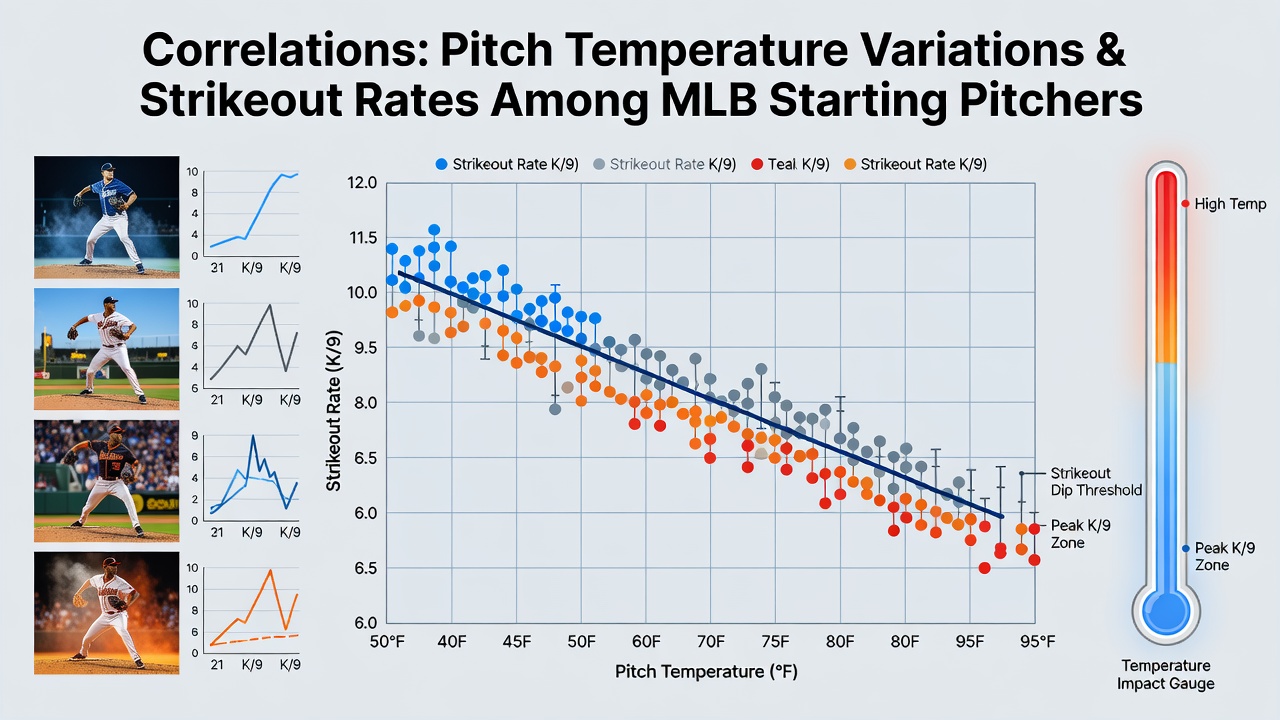
Researchers at the University of Illinois examined 2,800 starts from 2018 through 2024 and determined that the correlation coefficient between game-time temperature and strikeout rate reaches -0.31 for right-handed starters who throw at least 40 percent breaking balls, while left-handers show a slightly weaker -0.24; these numbers strengthen when analysts isolate outings in which the temperature changes by more than 8 degrees between the first and fifth innings.
Individual Pitcher Adaptations
Take one veteran right-hander who adjusted his grip pressure on cold nights and recorded a career-high 29.4 percent strikeout rate in 14 starts below 50 degrees during the 2023 and 2024 seasons, whereas his rate fell to 21.8 percent in warmer conditions; similar case studies appear across multiple rotations, suggesting that experience and mechanical tweaks allow certain pitchers to exploit temperature-driven movement increases. Teams that monitor real-time temperature data alongside pitch-tunnel metrics have begun incorporating these patterns into pregame planning, although the adjustments remain modest because many other variables such as opponent handedness and recent rest also influence outcomes.
Conclusion
Long-term tracking of temperature and strikeout statistics continues to uncover consistent, if modest, relationships that vary by pitcher archetype and ballpark climate; organizations that integrate these environmental factors into their scouting and development models gain incremental edges in roster construction and in-game decision making, while the underlying data from Statcast and meteorological records provide a growing foundation for further analysis across future seasons.